 In the same way that many value visual models of the spread of COVID-19, execs and cybersecurity analysts alike are interested in viewing and visualizing trends when it comes to the cyber threats that their organizations face. We’ve discussed visualization before in parts of our DDoS Protection Guide. Also, I discussed the need for visualization a bit in the article Cybersecurity Skills Your Boss Wants You to Have. Today, let’s dive a bit deeper into threat visualization.
Free Cybersecurity Tools: DIY Your SIEM
Smaller businesses sometimes feel they’re priced out of the market when it comes to visualizing cybersecurity threats. For example, they can’t afford the security information and event management (SIEM) tools that larger organizations use. This expense can also hinder cybersecurity students from learning how to use virtualization tools. But that doesn’t necessarily have to be the case.
Check out the basic elements necessary for visualizing security data:
- First, you need to obtain, or capture, network packets and log files.
- Then, you need an engine to “slice and dice,” or process, those packets.
- Finally, you need a visualization tool to represent them in a nice, friendly way.
You can add alerting and incident response to the above, but let’s first focus on what it means to get the packets, process them and then visualize them.
The good news is, you can compile these elements with free, open-source resources, which means anyone – whether a small business, a student or an IT pro who wants to practice and improve their skills – can develop their own, free visualization tool.
The Elastic Stack for Cybersecurity
It is common for organizations around the world to use something called the Elastic Stack to visualize cybersecurity events. The term Elastic Stack refers to the use of Elasticsearch, Logstash and Kibana. It used to be called the ELK stack, until a few years ago. It’s possible to visualize all sorts of information through this stack, including intrusion detection information.
Capturing and Analyzing Network Traffic
You have many options for capturing packets and detecting cybersecurity events. Snort and Zeek (formerly Bro) are two well-known intrusion detection tools. For this example, I’m going to use Zeek, a free, open-source software for analyzing network traffic and identifying suspicious traffic.
First, I installed Zeek on an Ubuntu 18.04 Linux system using the following command. Other Linux-based systems use similar commands, and you’d also use similar commands to install the other elements of the Elastic Stack.
$ sudo apt-get install zeek
If you haven’t done this before, Zeek and Hold My Beer Security both offer helpful tutorials. Whatever system you’re using, you should be able to easily find instructions within the system or through an internet search.
Once I installed Zeek, I configured it to listen to my local network by editing the /opt/zeek/etc/networks.cfg file. Zeek now grabs packets and processes them all day long. Using the zeekctl application, pictured below, I can re-load and start the application to sniff traffic.
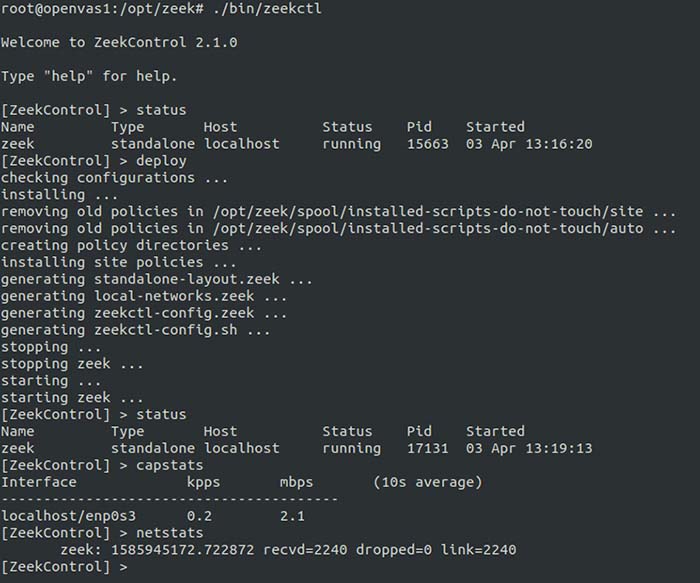
Figure 1: Configuring and managing Zeek
With Zeek up running on my network, I then conducted a simple DDoS SYN flood attack using the hping3 application:
$ sudo hping3 -i u1 -S -p 2124 -c 1000 10.0.0.252
The above command sent 1,000 SYN packets to port 2124 of the system with the IP address of 10.0.0.252. The -S option tells hpin3 to spoof the source IP address. Attackers always try to spoof IP addresses to thwart detection.
Zeek dutifully grabbed these packets off the network, and then showed that this particular attack was, indeed, a small SYN flood on the local network aimed at port 2124 on a system with the IP address of 10.0.0.252.
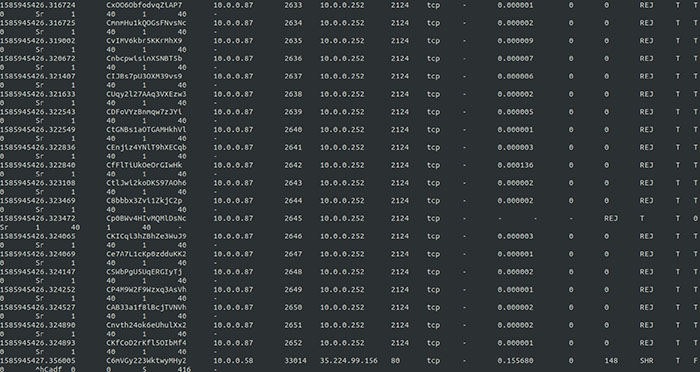
Figure 2: Capturing a SYN flood in Zeek
I also viewed additional logs to see how several new systems appeared on the network. One of those systems was the victim system with the IP address of 10.0.0.252. The other, with the 10.0.0.58 IP address, was the attacker. Zeek was able to identify this IP address even though I had spoofed the source IP address.
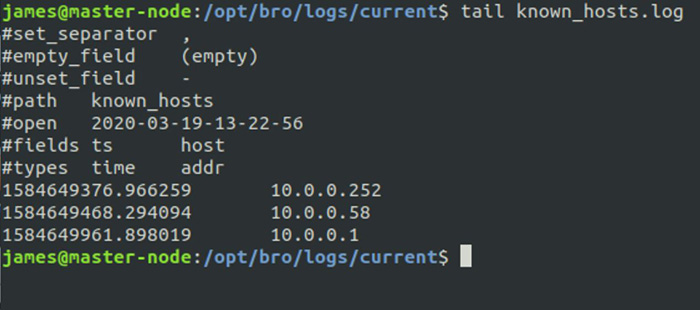
Figure 3: Viewing known hosts to identify the actual source of a spoofed DDoS attack
This is what security analysts need to identify and mitigate threats. But they need a way to communicate this to the executive team, and that’s where visualization comes in.
Processing Cybersecurity Data with the Elastic Stack
Security analysts use what’s called the Elastic Stack to turn Zeek’s log files into useable, actionable results. Typically, you’d install these using a specific manager, whether you’re installing them on Linux or Windows.
Here are the elements of the Elastic Stack, which is named after some of the elements below:
- Zeek: The packet grabber
- Beats/Filebeat: Obtains log data from one or many sources (e.g., Zeek), then forwards data to another system. It’s a “data shipper,” making it possible to centralize data for future processing
- Logstash: Processes data sent from Filebeat/Beats. This is the “slicer and dicer”
- Elasticsearch: It’s basically a fancy search engine that stores the collected data
- Kibana: Visualizes the data. The “front end” for the Elastic Stack
- Nginx: A load balancing web server that acts as a reverse proxy. Provides a front end for authentication and accepts connections. Allows interaction with Kibana
With this combination of tools, it’s possible to visualize traffic. You can also eliminate some of the above elements for the sake of simplicity. For example, you don’t have to use Ngnix for load balancing, but you’ll lose some of the scalability you may need later on.
These tutorials can help you install and configure the Elastic Stack:
- Installing the Elastic Stack
- How to Install Elasticsearch, Logstash, and Kibana (Elastic Stack) on Ubuntu 18.04
- Network Security with Bro (now Zeek) and Elasticsearch
Visualizing Cybersecurity Trends and Attacks
Through the Elastic Stack, I could use Kibana to view Zeek’s log files. A visualization tool like Kibana makes raw, bare-metal log files more user friendly. Now, I can see the logs sorted into columns (time and source).
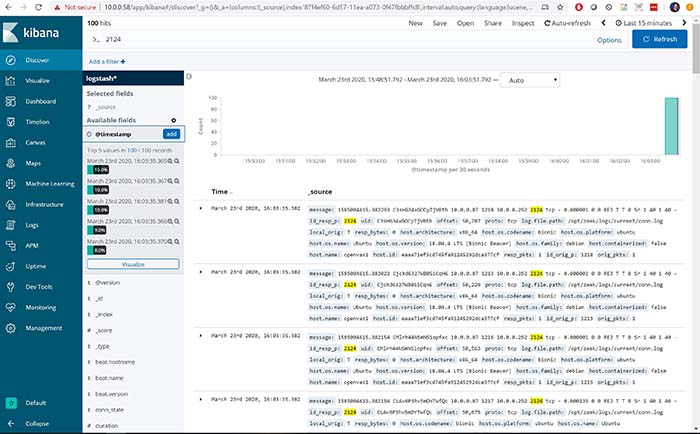
Figure 4: Visualizing Zeek logs via the Elastic Stack
Now I have something more visual, but I’m still not seeing trends. That’s where the next step comes in.
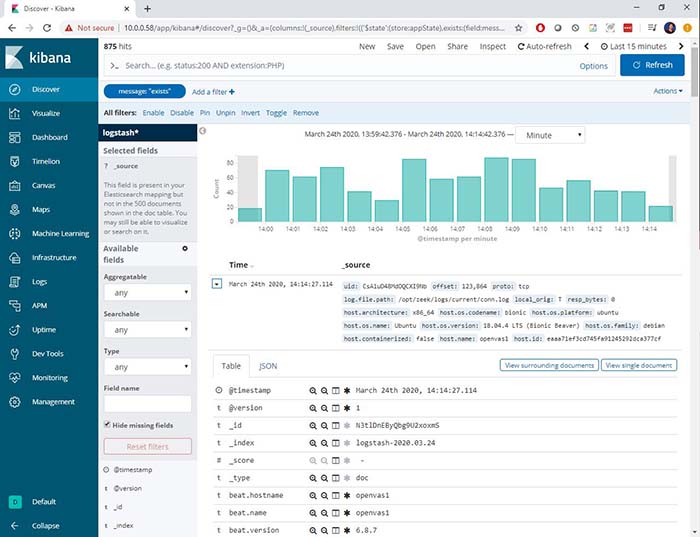
Figure 5: Showing trends in Zeek logs using the Elastic Stack
Now, we’re able to see quite a bit more information: It’s possible to see the spikes in traffic that Zeek was able to find. I can then drill down into the details as I wish, including the contents of the packet, and details about how it was captured.
Build Your Own Elastic Stack
If you don’t have the money for a fancy SIEM tool, consider building your own Elastic Stack and begin your adventure into visualizing cybersecurity events. It’ll take you some time, and you’ll probably experience a few moments of frustration along the way. But I think it’ll be worth it as you learn more about visualizing cybersecurity trends and attacks.
This exercise ties directly back to the CompTIA Cybersecurity Career Pathway:
- CompTIA Security+: You will be more able to identify, compare and contrast different types of attacks
- CompTIA Cybersecurity Analyst (CySA+): Going through the steps to use the Elastic Stack will help you understand many of the activities of a security analyst
- CompTIA PenTest+: This type of activity can help you fine-tune your pen testing activities so they are not as easily discovered by Zeek and visualized in the Elastic Stack
- CompTIA Advanced Security Practitioner (CASP+): The visualization tools in this article are significant parts of an enterprise security architecture
So, keep playing with these detection and visualization tools. The more you do, the more you’ll improve your hands-on, practical knowledge of how they work.
Ready to upgrade your IT skills? We've got great news! You can save big on CompTIA certifications and training right now.

